
Confirmatory Factor Analysis (CFA)
Confirmatory factor analysis (CFA) is a statistical technique for validating the factor structure of a set of observed variables. It tests whether a set of measured indicators reliably represents the underlying latent constructs they are meant to measure (Hair et al., 2018), which makes it a common step before evaluating structural relationships in covariance-based structural equation modeling (CB-SEM). As demonstrated in the tutorial article on CFA/CB-SEM in SmartPLS by Hair et al. (2025), SmartPLS offers CFA as part of its CB-SEM functionality, with graphical model building and maximum likelihood (ML) estimation that let researchers rigorously assess hypotheses about the relationships between observed and latent variables. This makes SmartPLS a clear alternative to IBM SPSS Amos.
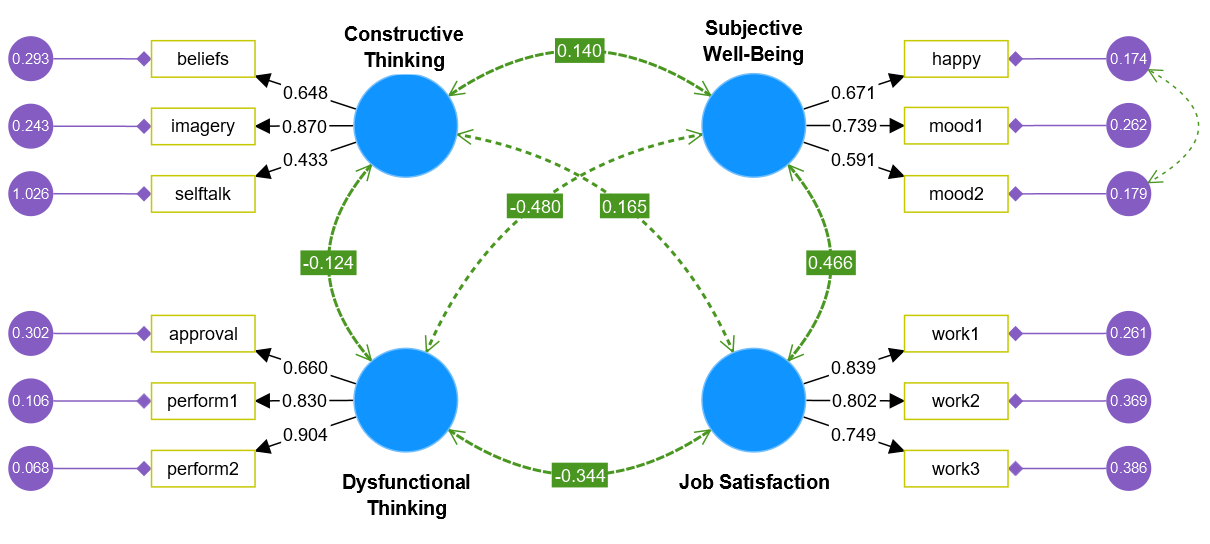
The following screenshot shows CFA results in SmartPLS for Kline's (2023) textbook example on job satisfaction:
CB-SEM Algorithm Settings for CFA in SmartPLS
Maximum Iterations
Defines the maximum number of iterations the optimizer will perform. This should be high enough to ensure convergence.
- Default value: 1,000
Starting Value Strategy
Researchers can enable apply configured starting values to use user-specified starting values; otherwise, SmartPLS applies one of the following default strategies:
| Parameter | Default strategy (mimics Lavaan) | One-zero strategy |
|---|---|---|
| Loadings | Fabin-style estimates | 1.0 |
| Path coefficients & covariances | 0.0 | 0.0 |
| Residual variances | 0.5 × indicator variance | 1.0 |
| Latent variances | 0.05 | 1.0 |
Stop Criteria
- Gradient criterion
Optimizer stops when:
||g|| < stop criterion × max(1, ||x||)- Default value: 10^-6
- Function value criterion
Optimizer stops when the improvement in the ML objective function is negligible:
(f' – f) / f < stop criterion- Default value: 10^-9
Special Assumptions
- Imply latent variable correlations Estimates correlations between all exogenous latent variables, even without a correlation arrow.
- Imply causal indicator correlations per construct Estimates correlations between causal indicators of a latent variable, even without correlation arrows.
- Imply a variance of 1.0 for causal indicators Constrains all causal indicator variances to 1.0 (overrides user-specified values). Helps mimic Lavaan defaults.
Mean Structure
Most CFA and SEM analyses focus on modeling the covariance structure of observed variables. In some cases (e.g., latent growth curve modeling), including a mean structure is necessary. A mean structure involves means and intercepts of latent and observed variables and requires constraints for identification (since only p observed means are available, with p = number of observed variables).
| Option | Description |
|---|---|
| No mean structure (default) | Ignores means and estimates only covariances. |
| Estimate mean structure, fix factor means to zero | Includes mean structure. Factor means are constrained to zero, while observed intercepts are estimated freely. |
| Estimate mean structure with only user-specified constraints | Includes mean structure with no predefined constraints. The user must specify identification constraints. |
CFA Examples in SmartPLS
SmartPLS provides directly computable CFA examples from established textbooks (Byrne, 2016; Hair et al., 2018; Kline, 2023; Schumacker & Lomax, 2010). SmartPLS replicates the results reported in these sources. Try out the CFA example projects in SmartPLS!
Frequently Asked Questions
What does CFA test?
CFA tests whether a set of measured indicators reliably represents the underlying latent constructs they are meant to measure. It validates a hypothesized factor structure before researchers move on to evaluating structural relationships.
How is CFA related to CB-SEM in SmartPLS?
CFA is offered as part of SmartPLS's covariance-based structural equation modeling (CB-SEM) functionality. It uses the same graphical model building environment and maximum likelihood (ML) estimation, and is typically run before evaluating the structural model.
Which estimation method does SmartPLS use for CFA?
SmartPLS estimates CFA models using maximum likelihood (ML), with configurable settings for maximum iterations, starting value strategy, and stop criteria to help ensure the optimizer converges to a good solution.
What starting value strategies are available for CFA in SmartPLS?
Researchers can apply their own configured starting values, or let SmartPLS use a default strategy that mimics Lavaan's defaults (with Fabin-style loading estimates) or a simpler one-zero strategy.
When do I need a mean structure for CFA?
A mean structure is not required for standard CFA, since most analyses only model the covariance structure. It becomes necessary in special cases such as latent growth curve modeling, and requires identification constraints because only as many observed means are available as there are observed variables.
Are there ready-made CFA examples I can try in SmartPLS?
Yes. SmartPLS provides directly computable CFA examples from established SEM textbooks (Byrne, 2016; Hair et al., 2018; Kline, 2023; Schumacker & Lomax, 2010), and it replicates the results reported in these sources.
Related SmartPLS Methods
- Covariance-based structural equation modeling (CB-SEM)
- Principal component analysis (PCA)
- PLS-SEM algorithm
- Consistent PLS-SEM (PLSc)
References
- Byrne, B. M. (2016). Structural equation modeling with AMOS: Basic concepts, applications, and programming (Multivariate Applications) (3rd ed.). Routledge.
- Hair, J. F., Babin, B. J., Ringle, C. M., Sarstedt, M., & Becker, J.-M. (2025). Covariance-based structural equation modeling (CB-SEM): A SmartPLS 4 software tutorial. Journal of Marketing Analytics, 13, 709–724.
- Hair, J. F., Black, W. C., Babin, B. J., & Anderson, R. E. (2018). Multivariate data analysis (8th ed.). Cengage Learning.
- Kline, R. B. (2023). Principles and practice of structural equation modeling (5th ed.). Guilford Press.
- Schumacker, R. E., & Lomax, R. G. (2010). A beginner's guide to structural equation modeling (3rd ed.). Routledge.
Cite correctly
Please always cite the use of SmartPLS!
Ringle, Christian M., Wende, Sven, & Becker, Jan-Michael. (2024). SmartPLS 4. Bönningstedt: SmartPLS. Retrieved from https://www.smartpls.com
