
Nonlinear Relationships
Standard PLS-SEM models assume that constructs affect one another in a linear fashion, but this assumption does not always hold. In some cases, the relationship between two constructs is better described by a curve than by a straight line, meaning the effect of one construct on another depends not only on the size of the change but also on the actual value of the predictor. Quadratic effects are the most common way of modeling such nonlinear relationships, and SmartPLS lets you estimate them directly in the modeling window.
Understanding Nonlinear Relationships in PLS-SEM
In PLS-SEM, relationships between constructs can take various forms. While linear relationships can be represented by straight lines (with positive or negative slopes) when plotting the latent variables' values in a scatterplot, nonlinear relationships include all associations that are not straight lines but curves.
When the relationship between two constructs is nonlinear, the size of the effect between two constructs not only depends on the magnitude of change in the exogenous construct but also on its value. In analyzing nonlinear effects, researchers have to make an assumption regarding the nature of the effect. While an abundance of different effect types is possible, quadratic effects are most common. The following figure shows the quadratic effect estimation of satisfaction on loyalty for the corporate reputation model in SmartPLS.
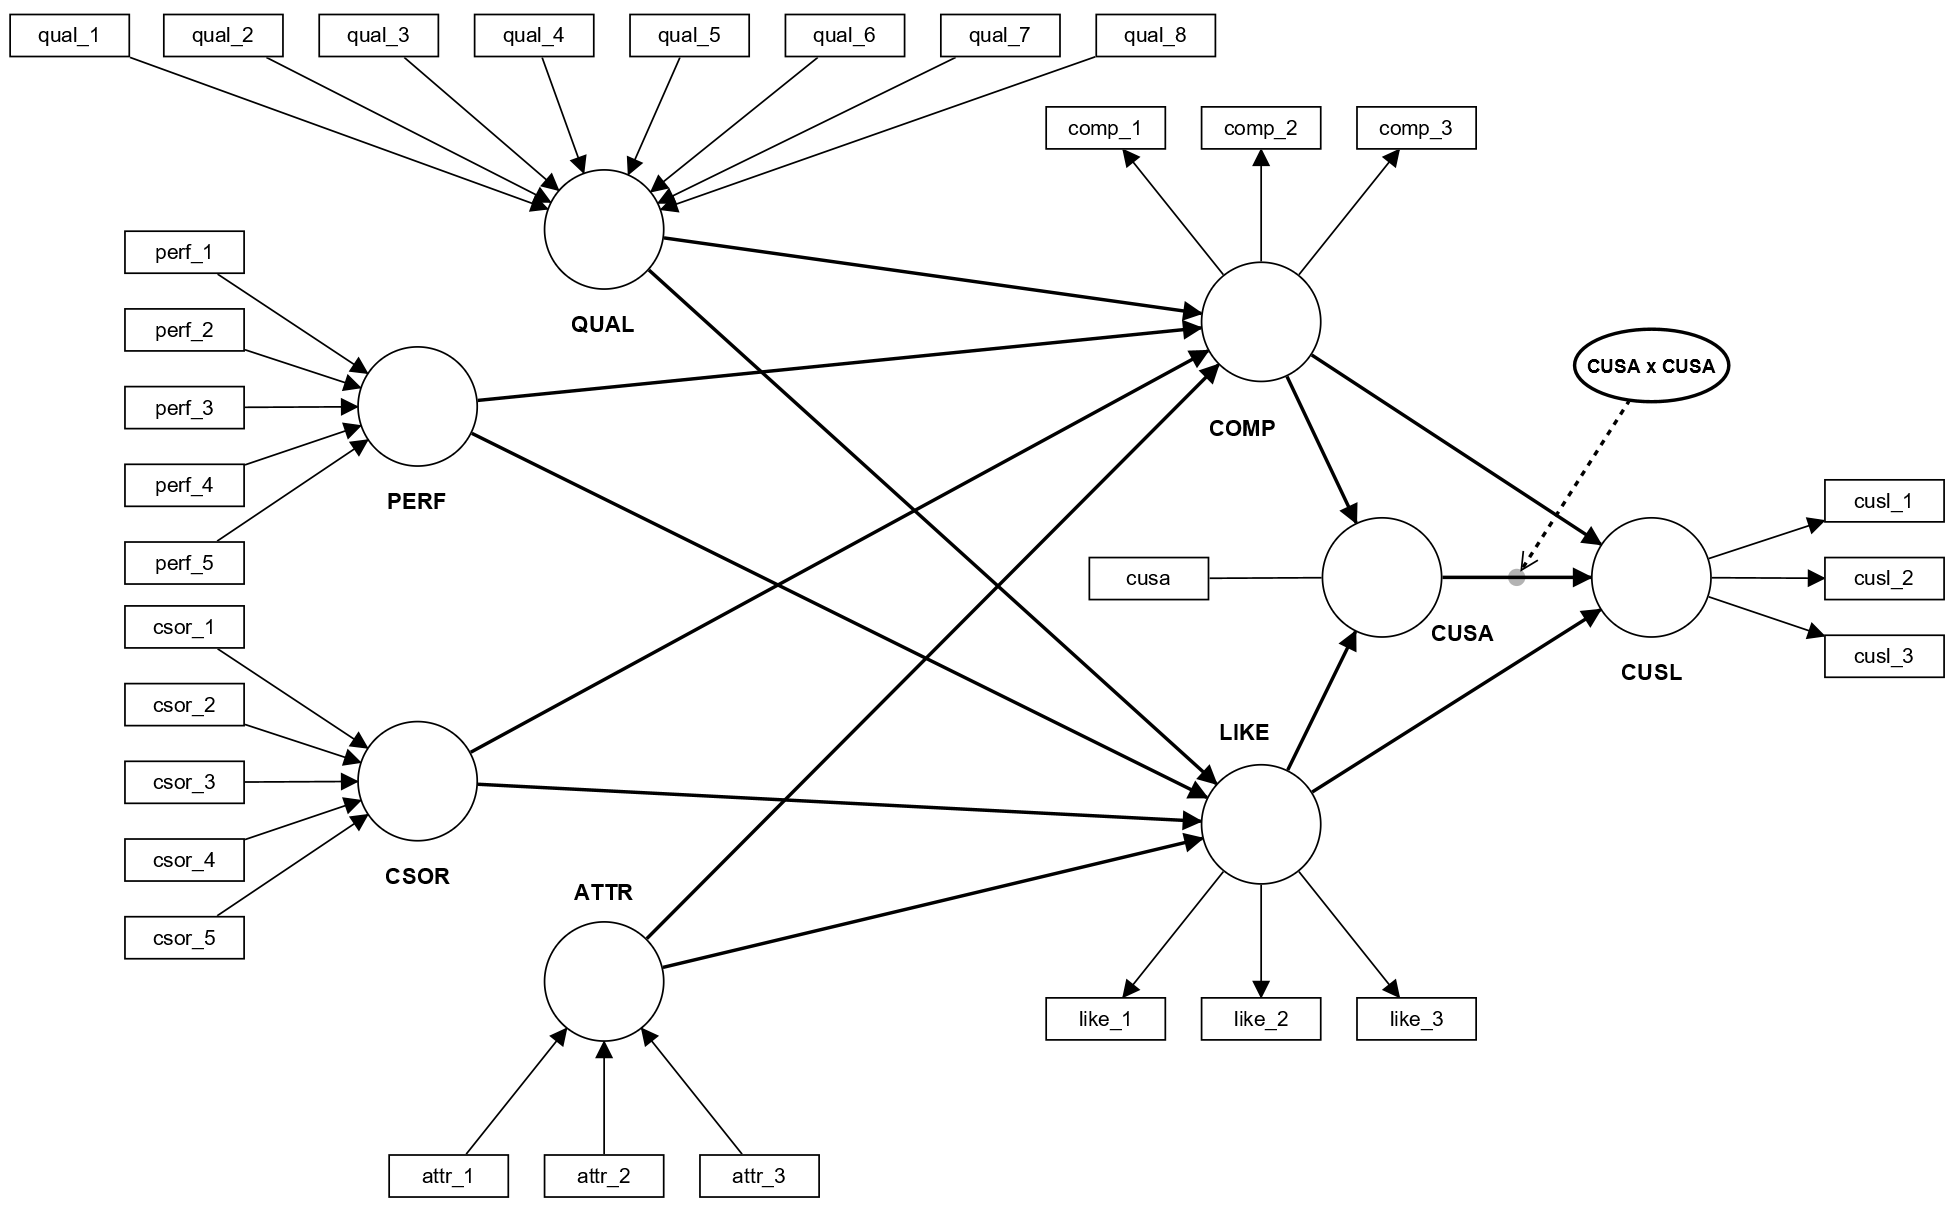
Modeling Quadratic Effects in SmartPLS
A nonlinear effect can be modeled as shown in the figure. To add the quadratic term, select the "Quadratic effect" option in the menu bar of the SmartPLS modeling window and click on the path relationship in the structural model to which you want to add the quadratic effect. Basco et al. (2021) and Hair et al. (2024) describe the analysis of quadratic effects and their use in SmartPLS in more detail.
In fact, a quadratic effect is like a self-moderation (see also the explanations on moderation). The computation of results uses the two-stage approach. This approach uses the latent variable scores of the latent predictor variable from the main effects model (without the quadratic effect term). These latent variable scores are saved and used to calculate the squared indicator for the second stage analysis that involves the quadratic effect term in addition to the predictor variable (see also the explanations on moderation). For the quadratic effect results interpretation, please take a look at Basco et al. (2021) and Hair et al. (2024).
Frequently Asked Questions
What is a nonlinear relationship in PLS-SEM?
A nonlinear relationship is one where the effect of an exogenous construct on an endogenous construct is not constant, but instead depends on the value of the exogenous construct itself. Plotted as latent variable values in a scatterplot, such relationships form a curve rather than a straight line.
What is the most common type of nonlinear effect in PLS-SEM?
Quadratic effects are the most common form of nonlinear relationship modeled in PLS-SEM, although other effect types are possible depending on the theoretical assumption a researcher makes about the nature of the relationship.
How does SmartPLS estimate quadratic effects?
SmartPLS uses the two-stage approach. First, it estimates the main effects model without the quadratic term and saves the latent variable scores of the predictor construct. Second, it uses these scores to calculate the squared indicator and includes the quadratic effect term together with the predictor construct in the final model.
How is a quadratic effect different from a moderation effect?
A quadratic effect can be understood as a self-moderation: instead of a separate moderator variable changing the strength of a relationship, the predictor construct interacts with itself. The estimation logic mirrors the two-stage approach used for moderation.
How do I add a quadratic effect in SmartPLS?
Select the "Quadratic effect" option in the menu bar of the SmartPLS modeling window, then click on the path relationship in the structural model to which you want to add the quadratic effect.
Related SmartPLS Methods
References
- Chin, W. W., Marcolin, B. L., & Newsted, P. R. (2003). A partial least squares latent variable modeling approach for measuring interaction effects: Results from a Monte Carlo simulation study and an electronic-mail emotion/adoption study. Information Systems Research, 14(2), 189–217.
- Ahrholdt, D. C., Gudergan, S., & Ringle, C. M. (2019). Enhancing loyalty: When improving consumer satisfaction and delight matters. Journal of Business Research, 94(1), 18–27.
- Basco, R., Hair, J. F., Ringle, C. M., & Sarstedt, M. (2021). Advancing family business research through modeling nonlinear relationships: Comparing PLS-SEM and multiple regression. Journal of Family Business Strategy, Article 100457.
- Becker, J.-M., Ringle, C. M., & Sarstedt, M. (2018). Estimating moderating effects in PLS-SEM and PLSc-SEM: Interaction term generation x data treatment. Journal of Applied Structural Equation Modeling, 2(2), 1–21.
- Hair, J. F., Sarstedt, M., Ringle, C. M., & Gudergan, S. P. (2024). Advanced issues in partial least squares structural equation modeling (PLS-SEM) (2nd ed.). Sage.
- Rigdon, E. E., Ringle, C. M., & Sarstedt, M. (2010). Structural modeling of heterogeneous data with partial least squares. In N. K. Malhotra (Ed.), Review of marketing research (pp. 255–296). Sharpe.
- More literature ...
Cite correctly
Please always cite the use of SmartPLS!
Ringle, Christian M., Wende, Sven, & Becker, Jan-Michael. (2024). SmartPLS 4. Bönningstedt: SmartPLS. Retrieved from https://www.smartpls.com
