
Necessary Condition Analysis (NCA)
Necessary condition analysis (NCA) is a data analysis technique for identifying necessary, but not sufficient, conditions in a data set. It complements traditional regression-based data analysis, including partial least squares structural equation modeling (PLS-SEM), as well as methods like qualitative comparative analysis (QCA), by asking a different question: not what tends to increase an outcome on average, but what a case cannot do without.
Necessity Versus Sufficiency Logic
Originally developed by Dul (2016), NCA is a widely adopted data analysis technique that enables the identification of necessary conditions in data sets (Bokrantz & Dul, 2023; Dul, 2020; Dul, 2025). NCA is a methodological approach that focuses on identifying necessary conditions, that is, conditions that must be present for a particular outcome to occur. This stands in contrast to sufficiency logic, which emphasizes conditions that should be present to produce the outcome but are not strictly required (e.g., coefficients obtained by the regression analysis or a path model).
In necessity logic, a condition is considered necessary if the outcome cannot happen without it: if the necessary condition is missing, the outcome will definitely not occur. However, having the necessary condition alone does not guarantee the outcome; other factors may also need to be in place (Dul, 2024; Dul et al., 2023). Thus, necessary conditions represent "bottlenecks" or prerequisites that set the upper boundary for the outcome: no outcome beyond a certain level is possible unless the necessary condition is met. Sufficiency logic, by contrast, deals with conditions that, when present, should lead to the outcome. A sufficient condition means that the presence of this condition guarantees the outcome, although the outcome may also occur via other pathways where that specific condition is absent. To put it simply:
| Condition type | Meaning |
|---|---|
| Necessary (must-have) | Without these, the outcome cannot occur. They are prerequisites or non-negotiable requirements. |
| Sufficient (should-have) | With these, the outcome is guaranteed to occur, but they are not mandatory because the outcome might still happen through alternative means. |
NCA's unique contribution lies in systematically uncovering these must-have conditions, which traditional sufficiency-based approaches (like regression or fsQCA) may overlook because they focus primarily on whether certain factors increase the likelihood or guarantee the outcome, rather than whether the outcome is impossible without them. By identifying and quantifying such necessary conditions, NCA provides critical insights into the constraints and minimal requirements governing an outcome.
NCA in PLS-SEM
NCA can be used for regression models and partial least squares structural equation modeling (PLS-SEM), as explained in detail by Richter et al. (2020) and Richter et al. (2023b) -- see also Hair et al. (2024) and Richter et al. (2023a). SmartPLS fully supports NCA for regression models (i.e., for regression models via the algorithm Necessary condition analysis (NCA)). By using the unstandardized latent variable scores or latent variable scores on a scale from 0 to 100 as obtained by an importance-performance map analysis (IPMA), it is possible to run the NCA in PLS-SEM for the partial regression models of the structural model. Note: The combined IPMA and NCA (cIPMA) represents a recent extension of the use of PLS-SEM's results for an NCA. For further details on the cIPMA, see Hauff et al. (2024) and the SmartPLS software tutorial by Sarstedt et al. (2024).
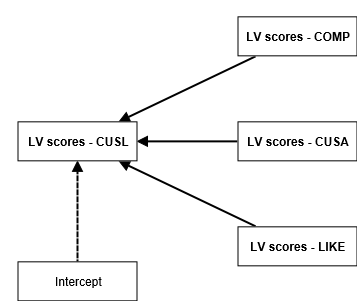
The figure below shows a model example for an NCA; for further explanations, see the NCA chapter in Hair et al. (2024) and the case study on the NCA in PLS-SEM using SmartPLS:
The Ceiling Line: How NCA Identifies Necessary Conditions
Instead of analyzing the average relationships between dependent and independent variables, NCA aims to reveal areas in scatter plots of dependent and independent variables that may indicate the presence of a necessary condition. While ordinary least squares (OLS) regression-based techniques establish a linear function in the center of the relevant data points, NCA determines a ceiling line on top of the data. The figure below shows two default ceiling lines: (1) the ceiling envelopment - free disposal hull (CE-FDH) line, which is a non-decreasing step-wise linear line (step function), and (2) the ceiling regression - free disposal hull (CR-FDH) line, which is a simple linear regression line through the CE-FDH line.
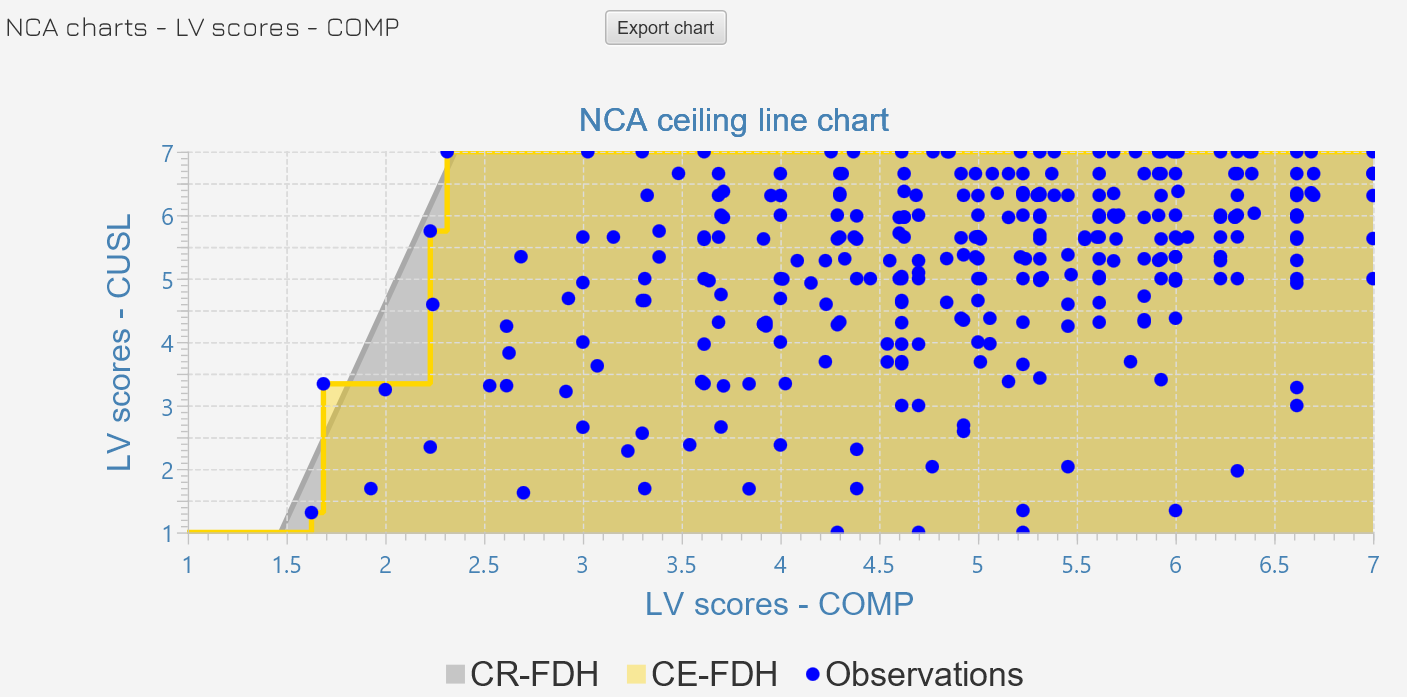
The ceiling line separates the space with observations from the space without observations. The larger the empty space, the larger the constraint that X puts on Y. The ceiling line also indicates the minimum level of X that is required to obtain a certain level of Y. This NCA outcome differs from the interpretation of linear regression, where an increase of X leads, on average, to an increase of Y.
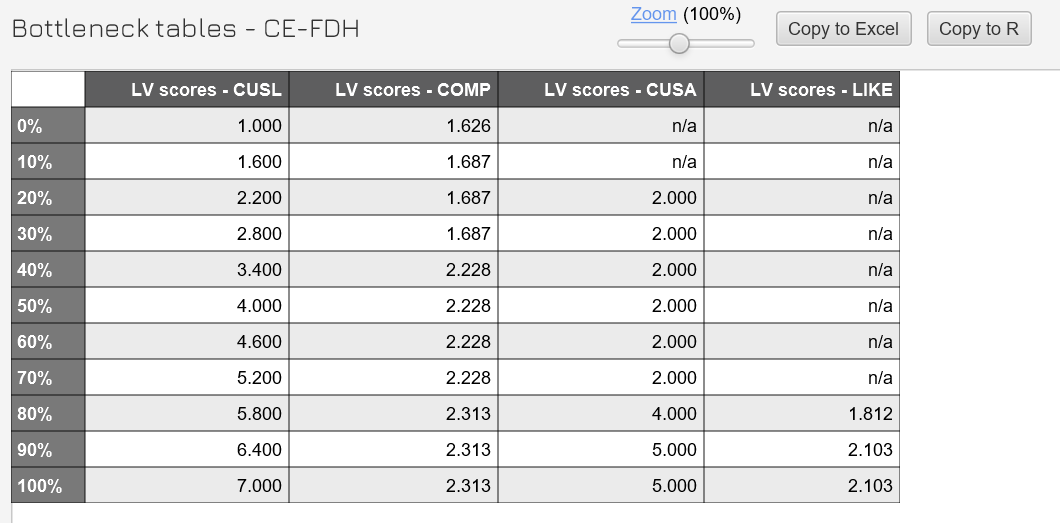
Alternatively, the bottleneck table presents the ceiling line results in tabular form (see figure below). The first column of the table shows the outcome, while the next column (and any additional columns) represents the condition(s) that must be satisfied to achieve the outcome. The results for both the outcome and the condition(s) may refer to actual values, percentage values of the range, and percentiles.
Key NCA Parameters: Ceiling Accuracy and Effect Size
Two key NCA parameters are the ceiling accuracy and the necessity effect size d. The ceiling accuracy represents the number of observations that are on or below the ceiling line divided by the total number of observations, multiplied by 100. While the accuracy of the CE-FDH ceiling line is per definition 100%, the accuracy of other lines, such as the CR-FDH, can be less than 100%. There is no specific rule regarding the acceptable level of accuracy; however, comparing the estimated accuracy with a benchmark value (e.g., 95%) can help assess the quality of the generated solution.
The necessity effect size d and its statistical significance indicate whether a variable or construct is a necessary condition (Dul et al., 2020). d is calculated by dividing the "empty" space (called the ceiling zone) by the entire area that can contain observations (called the scope), so by definition d ranges between 0 ≤ d ≤ 1.
| Effect size d | Interpretation |
|---|---|
| 0 < d < 0.1 | Small effect |
| 0.1 ≤ d < 0.3 | Medium effect |
| 0.3 ≤ d < 0.5 | Large effect |
| d ≥ 0.5 | Very large effect |
Dul (2016) proposed these benchmarks for characterizing effect size magnitude. However, the absolute magnitude of d only indicates substantive significance, that is, the meaningfulness of the effect size from a practical perspective. NCA therefore also lets researchers evaluate the statistical significance of the necessity effect size using a permutation test, which should also be considered when deciding about a necessity hypothesis (Dul, 2020). SmartPLS supports the permutation-based significance testing of the effect size d (i.e., for regression models via the algorithm NCA permutation).
NCA-ESSE: A Sensitivity Extension
Becker et al. (2026) introduce a novel method, the NCA with an effect size sensitivity extension (NCA-ESSE), which allows researchers to better understand the sensitivity of the NCA results to extreme response patterns. They offer guidelines for using the NCA-ESSE method and illustrate its efficacy using a well-known job satisfaction model. By extending NCA's capabilities to assess the sensitivity of necessary conditions, the research by Becker et al. (2026) enhances the method's practical utility and helps ensure the robustness and replicability of its outcomes and conclusions.
NCA Settings in SmartPLS
The Necessary condition analysis (NCA) algorithm for regression models in SmartPLS only requires a single parameter setting, which is the Number of steps for bottleneck tables. Thereby, you can specify the number of steps into which the dependent variable is divided for NCA's bottleneck tables. The default value is 10, which divides the displayed results into 10% steps from 0% to 100%. However, you may also choose a more detailed result display. For example, a value of 20 divides the results into 5% steps from 0% to 100%.
Moreover, when executing the NCA, make sure that the scale of your indicators is as expected. For example, an interval scale from 1 to 7 should show the minimum value of 1 and the maximum value of 7 (e.g., this may not be the case if no respondent selected the 1). This is important to ensure the accuracy of results.
NCA Permutation Settings in SmartPLS
The NCA permutation algorithm for regression models in SmartPLS requires settings that are described in the following.
Subsamples
The number of permutations determines, how often the overall dataset is randomly permuted into the two groups to approximate the non-parametric reference distribution for the null hypothesis.
To ensure stability of the results, the number of permutations should be sufficiently large. For a quick initial assessment, one may choose a smaller number of permutation subsamples (e.g., 1,000). For obtaining the final results, however, one should use a large number of permutations (e.g., at least 5,000).
Do parallel processing
If chosen the bootstrapping algorithm will be performed on multiple processors (if your computer offers more than one core). As each subsample can be calculated individually, subsamples can be computed in parallel mode. Using parallel computing will reduce computation time.
Significance level
Specifies the significance level of the test statistic.
Random number generator
The algorithm randomly generates subsamples from the original data set, which requires a seed. You have the option to choose between a random seed and a fixed seed.
The random seed produces different random numbers and therefore results every time the algorithm is executed (this was the default and only option in SmartPLS 3).
The fixed seed uses a pre-specified seed that is the same for every execution of the algorithm. Thus, it produces the same results if the same number of subsamples are drawn. It thereby addresses concerns about the replicability of research findings.
Frequently Asked Questions
What does NCA add that regression-based methods like PLS-SEM do not?
Regression-based methods, including PLS-SEM, focus on sufficiency logic: which conditions, on average, increase the likelihood of an outcome. NCA instead applies necessity logic, identifying conditions without which the outcome cannot occur at all, regardless of how favorable other conditions are.
Can I combine NCA with PLS-SEM?
Yes. SmartPLS supports NCA for regression models, and by using unstandardized latent variable scores or the 0-100 scores obtained from an importance-performance map analysis (IPMA), you can also apply NCA to the partial regression models of a PLS-SEM structural model. The combined IPMA and NCA (cIPMA) extends this further (Hauff et al., 2024; Sarstedt et al., 2024).
What is the ceiling line and why does NCA use it?
Instead of fitting a line through the center of the data like OLS regression, NCA fits a ceiling line on top of the data, separating the region with observations from the empty region without them. The larger the empty space, the greater the constraint the predictor puts on the outcome, and the ceiling line shows the minimum level of the predictor required to reach a given level of the outcome.
What do the CE-FDH and CR-FDH lines represent?
The ceiling envelopment - free disposal hull (CE-FDH) line is a non-decreasing step function with 100% accuracy by definition. The ceiling regression - free disposal hull (CR-FDH) line is a simple linear regression line through the CE-FDH line and can have an accuracy below 100%.
How do I interpret the necessity effect size d?
d ranges between 0 and 1 and reflects the empty ceiling zone relative to the total scope. Following Dul (2016), values below 0.1 indicate a small effect, 0.1 to below 0.3 a medium effect, 0.3 to below 0.5 a large effect, and 0.5 or above a very large effect. Because the magnitude of d only reflects practical significance, its statistical significance should also be assessed with a permutation test.
What does the "number of steps for bottleneck tables" setting control?
It specifies how finely the dependent variable is divided in the bottleneck table. The default of 10 produces 10% steps from 0% to 100%; a value of 20 would produce 5% steps for a more detailed display.
Related SmartPLS Methods
References
- Becker, J.-M., Richter, N. F., Ringle, C. M., & Sarstedt, M. (2026). Must-have, or maybe not? A sensitivity-based extension to necessary condition analysis. Journal of Business Research, 206, Article 115920.
- Bokrantz, J., & Dul, J. (2023). Building and testing necessity theories in supply chain management. Journal of Supply Chain Management, 59(1), 48–65.
- Dul, J. (2016). Necessary condition analysis (NCA): Logic and methodology of "necessary but not sufficient" causality. Organizational Research Methods, 19(1), 10–52.
- Dul, J. (2020). Conducting necessary condition analysis. Sage.
- Dul, J. (2024). A different causal perspective with necessary condition analysis. Journal of Business Research, 177, Article 114618.
- Dul, J. (2025). Advances in necessary condition analysis. Online book, version 1.8.
- Dul, J., Hauff, S., & Bouncken, R. B. (2023). Necessary condition analysis (NCA): Review of research topics and guidelines for good practice. Review of Managerial Science, 17(2), 683–714.
- Dul, J., van der Laan, E., & Kuik, R. (2020). A statistical significance test for necessary condition analysis. Organizational Research Methods, 23(2), 385–395.
- Hair, J. F., Sarstedt, M., Ringle, C. M., & Gudergan, S. P. (2024). Advanced issues in partial least squares structural equation modeling (PLS-SEM) (2nd ed.). Sage.
- Hauff, S., Richter, N. F., Sarstedt, M., & Ringle, C. M. (2024). Importance and performance in PLS-SEM and NCA: Introducing the combined importance-performance map analysis (cIPMA). Journal of Retailing and Consumer Services, 78, Article 103723.
- Richter, N. F., Hauff, S., Kolev, A. E., & Schubring, S. (2023a). Dataset on an extended technology acceptance model: A combined application of PLS-SEM and NCA. Data in Brief, Article 109190.
- Richter, N. F., Hauff, S., Ringle, C. M., Sarstedt, M., Kolev, A., & Schubring, S. (2023b). How to apply necessary condition analysis in PLS-SEM. In J. F. Hair, R. Noonan, & H. Latan (Eds.), Partial least squares structural equation modeling: Basic concepts, methodological issues and applications (pp. 267–297). Springer.
- Richter, N. F., Schubring, S., Hauff, S., Ringle, C. M., & Sarstedt, M. (2020). When predictors of outcomes are necessary: Guidelines for the combined use of PLS-SEM and NCA. Industrial Management & Data Systems, 120(12), 2243–2267.
- Sarstedt, M., Richter, N. F., Hauff, S., & Ringle, C. M. (2024). Combined importance-performance map analysis (cIPMA) in partial least squares structural equation modeling (PLS-SEM): A SmartPLS 4 tutorial. Journal of Marketing Analytics, 12, 746–760.
- More literature ...
Cite correctly
Please always cite the use of SmartPLS!
Ringle, Christian M., Wende, Sven, & Becker, Jan-Michael. (2024). SmartPLS 4. Bönningstedt: SmartPLS. Retrieved from https://www.smartpls.com
