
Cross-validated Predictive Ability Test (CVPAT)
The cross-validated predictive ability test (CVPAT) is a statistical test that researchers can use to evaluate and substantiate the out-of-sample predictive capabilities of their PLS-SEM model. It represents an alternative to PLSpredict for prediction-oriented assessment and is used for statistically comparing a model's predictive performance against benchmark predictions. In SmartPLS, CVPAT results are available via the PLSpredict results report.
How CVPAT Works
The CVPAT was developed by Liengaard et al. (2021) for prediction-oriented model comparison in PLS-SEM, and Sharma et al. (2023) extended it for evaluating a model's predictive capabilities. CVPAT applies an out-of-sample prediction approach to calculate the model's prediction error, which determines the average loss value.
For prediction-based model assessment, this average loss value is compared against two benchmarks:
- The average loss value of a prediction using indicator averages (IA) as a naive benchmark.
- The average loss value of a linear model (LM) forecast as a more conservative benchmark.
PLS-SEM's average loss should be lower than the average loss of the benchmarks, which is expressed by a negative difference in the average loss values. CVPAT tests whether PLS-SEM's average loss is significantly lower than the average loss of the benchmarks. Therefore, the difference of the average loss values should be significantly below zero to substantiate better predictive capabilities of the model compared to the prediction benchmarks.
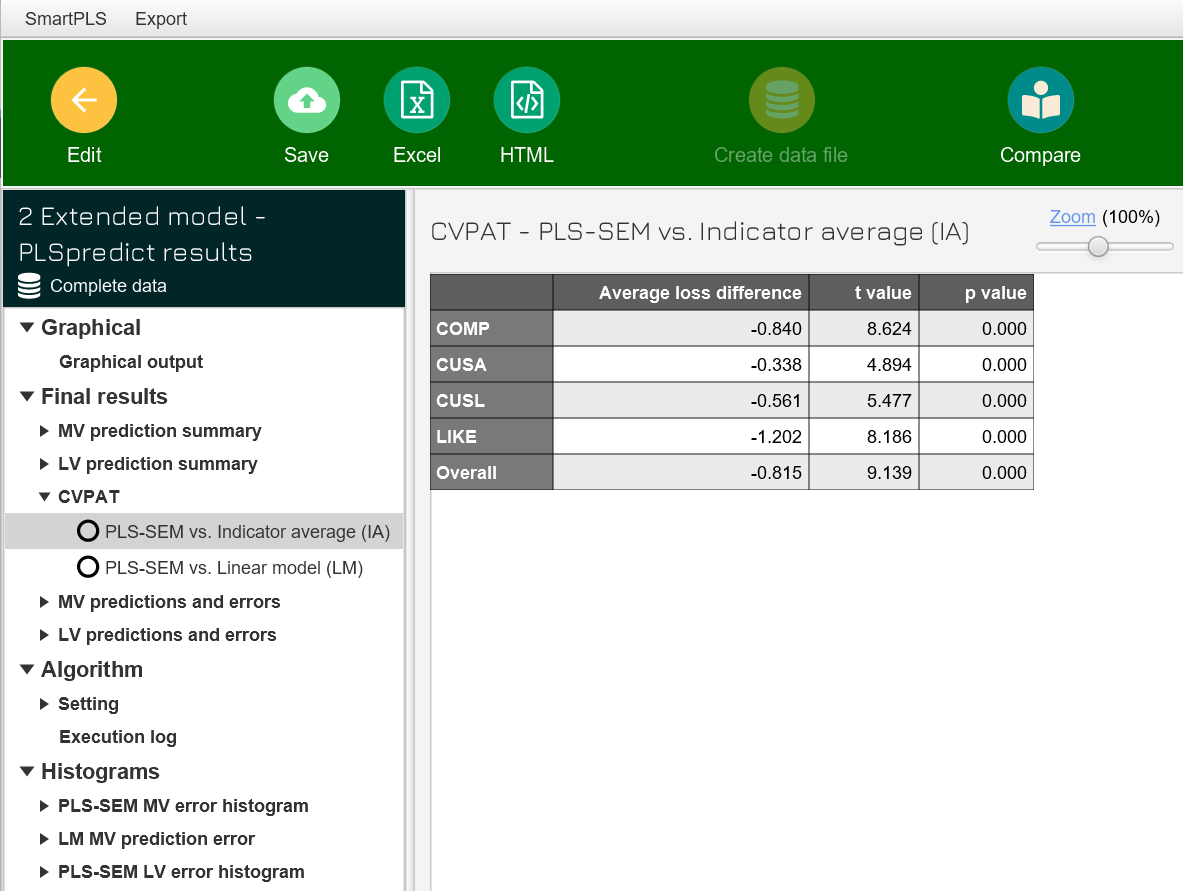
The IA and LM benchmark results are comparable to the Q² and LM values obtained by PLSpredict (Shmueli et al., 2016, 2019). However, while PLSpredict uses the indicators of the earliest antecedent constructs for the results computation, the original CVPAT publications use the indicators of direct antecedents (for further details on early and direct antecedents, see Danks, 2021). For better comparability of results, SmartPLS uses the earliest antecedents in both PLSpredict and CVPAT.
The out-of-sample predictions used in CVPAT assist researchers in evaluating the predictive capabilities of their model. Therefore, CVPAT should be included in the evaluation of PLS-SEM results (Hair et al., 2022). Additional procedures and extensions are under development and may become part of future SmartPLS versions (e.g., CVPAT-based model comparison).
PLSpredict Settings for Obtaining CVPAT Results in SmartPLS
| Setting | Default | Description |
|---|---|---|
| Number of folds (k) | 10 | In k-fold cross-validation, the algorithm splits the full data set into k equally sized subsets. It then predicts each fold (hold-out sample) using the remaining k-1 subsets, which together form the training sample. For example, with k=10, a data set of 200 observations is split into 10 subsets of 20 observations, and the algorithm predicts each fold ten times using the nine remaining subsets. |
| Number of repetitions | 10 | Indicates how often the PLSpredict algorithm runs the k-fold cross-validation on random splits of the full data set into k folds. |
A single random split into k-folds can make the predictions strongly dependent on that particular random assignment of observations, so executions of the algorithm at different points in time may vary in their predictive performance results. Repeating the k-fold cross-validation with different random data partitions, and averaging across the repetitions, ensures a more stable estimate of the predictive performance of the PLS path model.
Frequently Asked Questions
What is CVPAT used for?
CVPAT lets researchers statistically test whether their PLS-SEM model's out-of-sample predictive performance is significantly better than benchmark predictions. It is used for prediction-oriented model comparison and for substantiating a model's predictive capabilities.
How is CVPAT different from PLSpredict?
Both procedures assess out-of-sample predictive power, and CVPAT results are available directly within the PLSpredict results report in SmartPLS. PLSpredict provides descriptive prediction statistics (e.g., Q²_predict, RMSE, MAE) for individual indicators, while CVPAT provides a formal significance test of whether the model's average loss is significantly lower than the average loss of the indicator-average (IA) and linear model (LM) benchmarks.
What does a significant CVPAT result mean?
A significant CVPAT result means that the difference between the model's average loss and the benchmark's average loss is significantly below zero, which substantiates that the model has better predictive capabilities than the naive (IA) or conservative (LM) benchmark.
What are the IA and LM benchmarks in CVPAT?
The indicator-average (IA) benchmark is a naive prediction based on the mean of the indicators, while the linear model (LM) benchmark is a more conservative forecast based on a linear regression model. Both benchmarks are comparable to the corresponding benchmarks used in PLSpredict.
How many folds and repetitions should I use for CVPAT?
SmartPLS defaults to 10 folds and 10 repetitions. Repeating the k-fold cross-validation across multiple random partitions and averaging the results produces a more stable estimate of predictive performance than relying on a single random split.
Related SmartPLS Methods
References
- Danks, N. (2021). The piggy in the middle: The role of mediators in PLS-SEM-based prediction. ACM SIGMIS Database: the DATABASE for Advances in Information Systems, 52, 24–42.
- Hair, J. F., Hult, G. T. M., Ringle, C. M., & Sarstedt, M. (2027). A primer on partial least squares structural equation modeling (PLS-SEM). (4th ed.). Sage.
- Liengaard, B. D., Sharma, P. N., Hult, G. T. M., Jensen, M. B., Sarstedt, M., Hair, J. F., & Ringle, C. M. (2021). Prediction: Coveted, yet forsaken? Introducing a cross-validated predictive ability test in partial least squares path modeling. Decision Sciences, 52(2), 362–392.
- Sharma, P. N., Liengaard, B. D., Hair, J. F., Sarstedt, M., & Ringle, C. M. (2023). Predictive model assessment and selection in composite-based modeling using PLS-SEM: Extensions and guidelines for using CVPAT. European Journal of Marketing, 57(6), 1662–1677.
- Shmueli, G., Ray, S., Estrada, J. M. V., & Chatla, S. B. (2016). The elephant in the room: Predictive performance of PLS models. Journal of Business Research, 69(10), 4552–4564.
- Shmueli, G., Sarstedt, M., Hair, J. F., Cheah, J. H., Ting, H., Vaithilingam, S., & Ringle, C. M. (2019). Predictive model assessment in PLS-SEM: Guidelines for using PLSpredict. European Journal of Marketing, 53(11), 2322–2347.
- More literature ...
Cite correctly
Please always cite the use of SmartPLS!
Ringle, Christian M., Wende, Sven, & Becker, Jan-Michael. (2024). SmartPLS 4. Bönningstedt: SmartPLS. Retrieved from https://www.smartpls.com
