Reasons for Different Results in SmartPLS 4
In some cases, SmartPLS 4 results may be different from those obtained by SmartPLS 3. This can have several reasons, which can be related to the data import, updated algorithms, or the settings used in SmartPLS 4 or a combination of these issues.
Data file not setup correctly
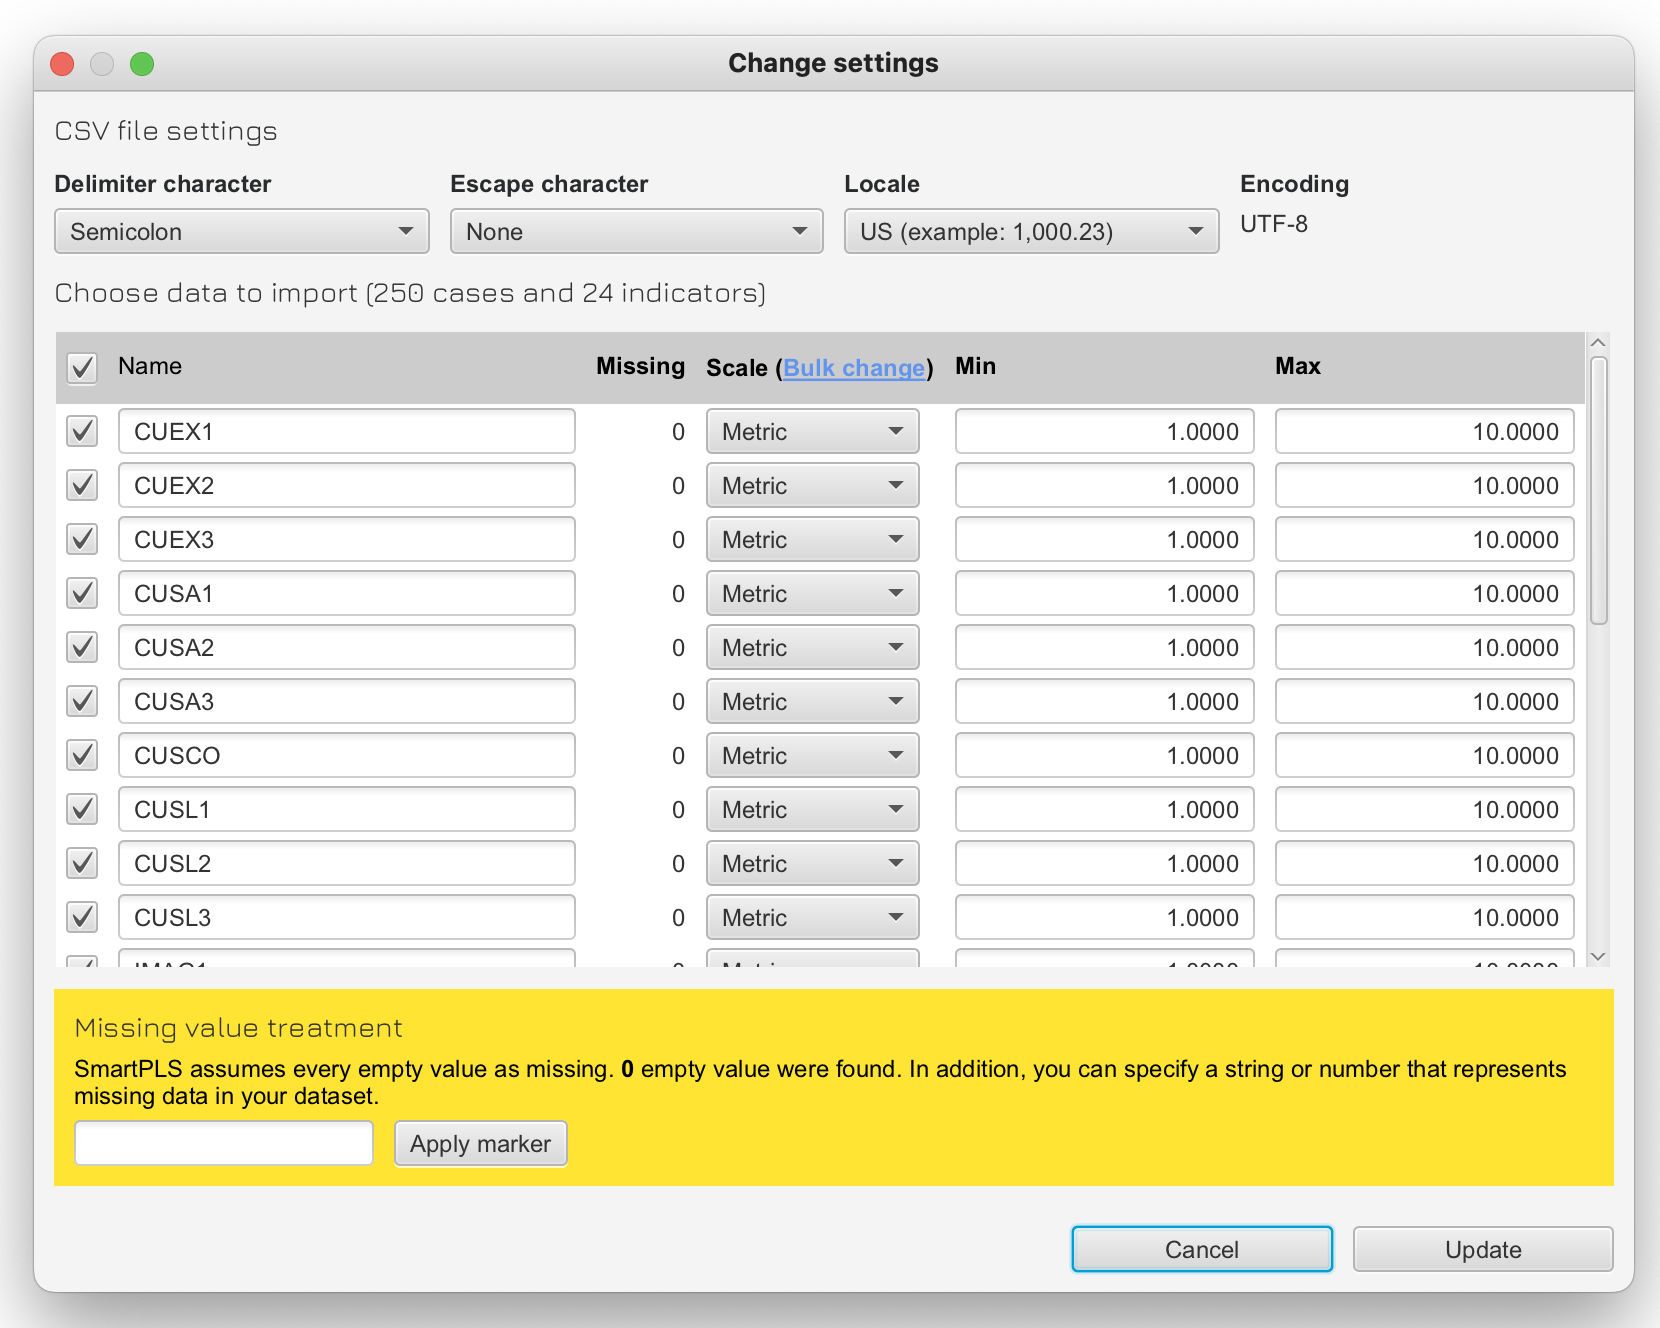
Make sure that your datafile is set up correctly in SmartPLS 4. If it is displayed in red color, please double-click to open its setup. Then check the settings for the delimiter, escape character and locale.
Missing value not marked correctly
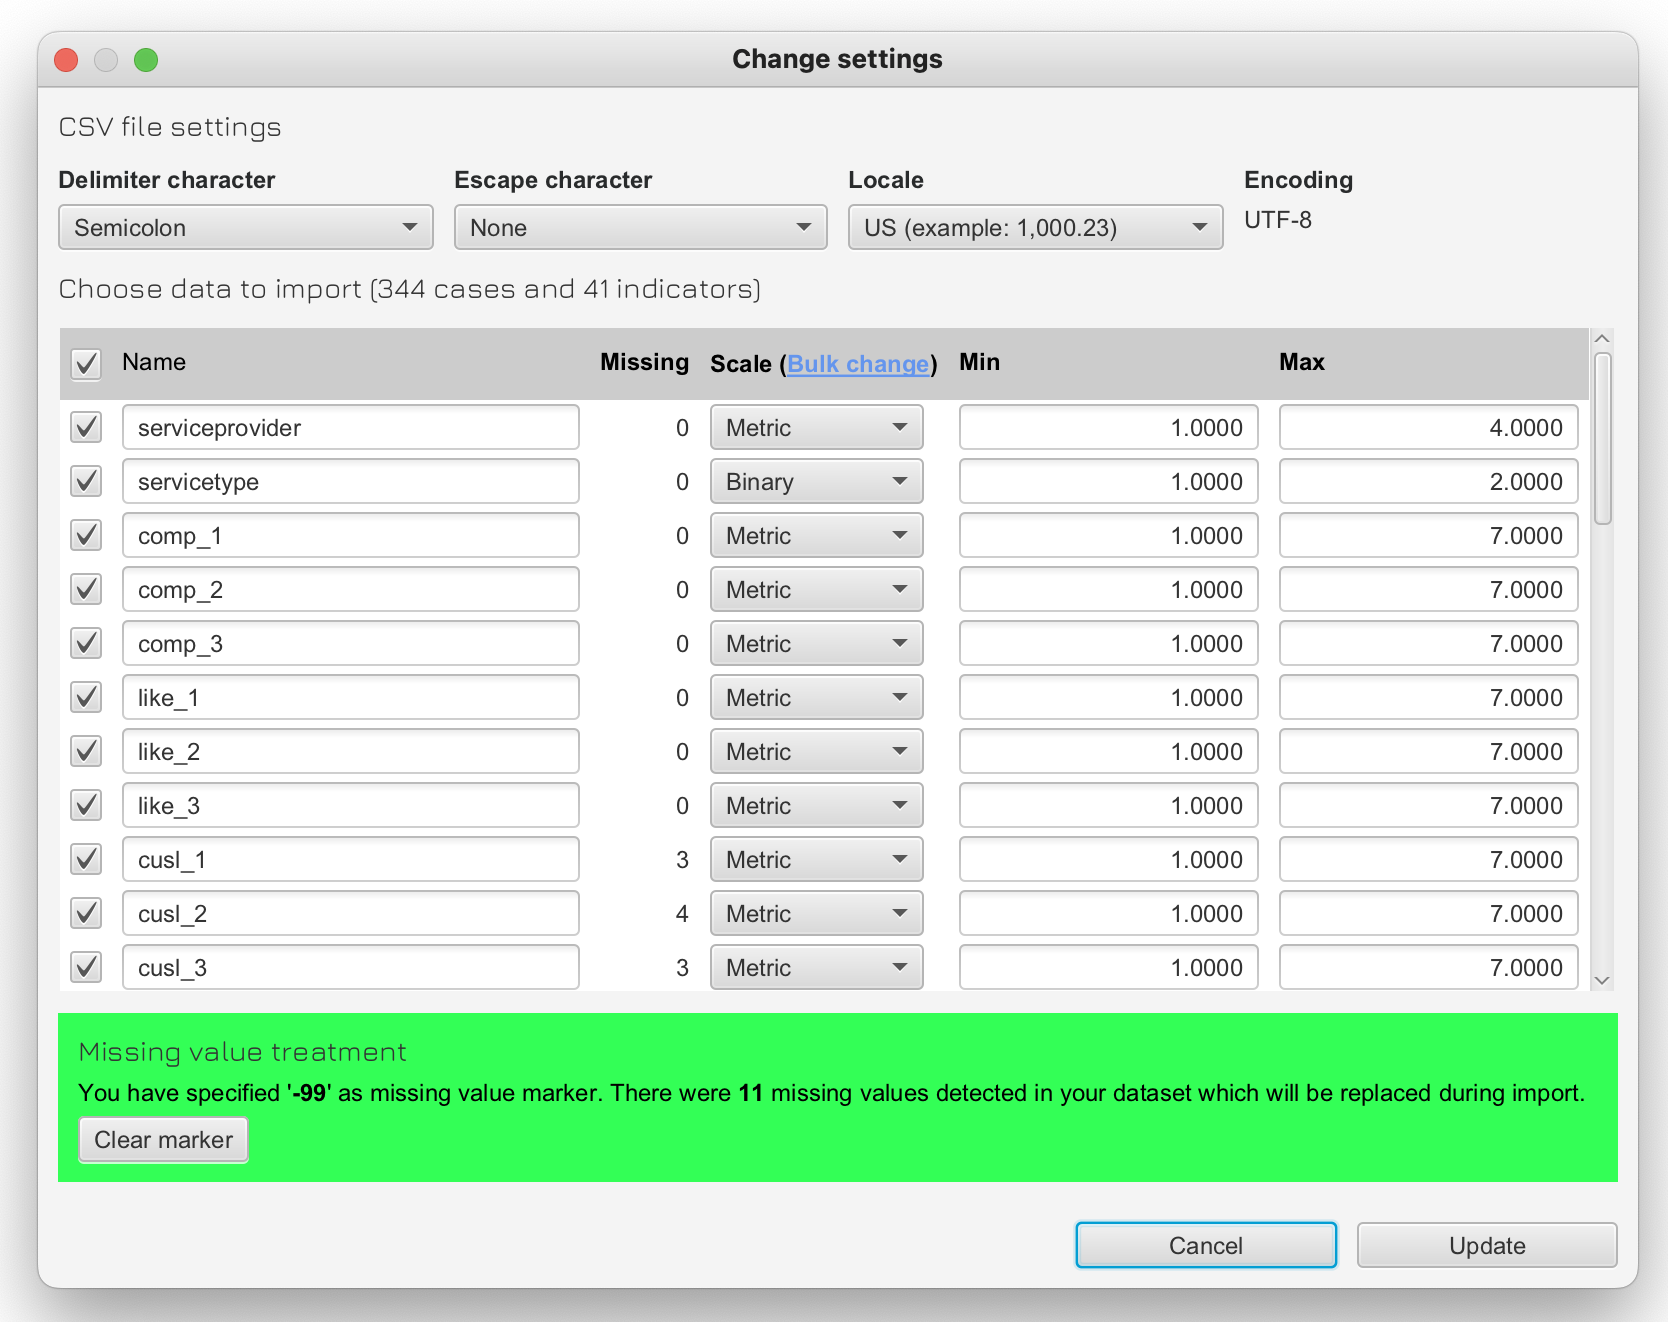
When you import a new data file or open a data file from an old SmartPLS 3 project, make sure that missing values are handled. In SmartPLS 3, a placeholder String (e.g. -99) was defined to indicate missing values in the dataset. In SmartPLS 4 you can use the data file setup dialog to apply such a marker. It will then replace all values in the dataset with an empty value.
Missing value handled differently
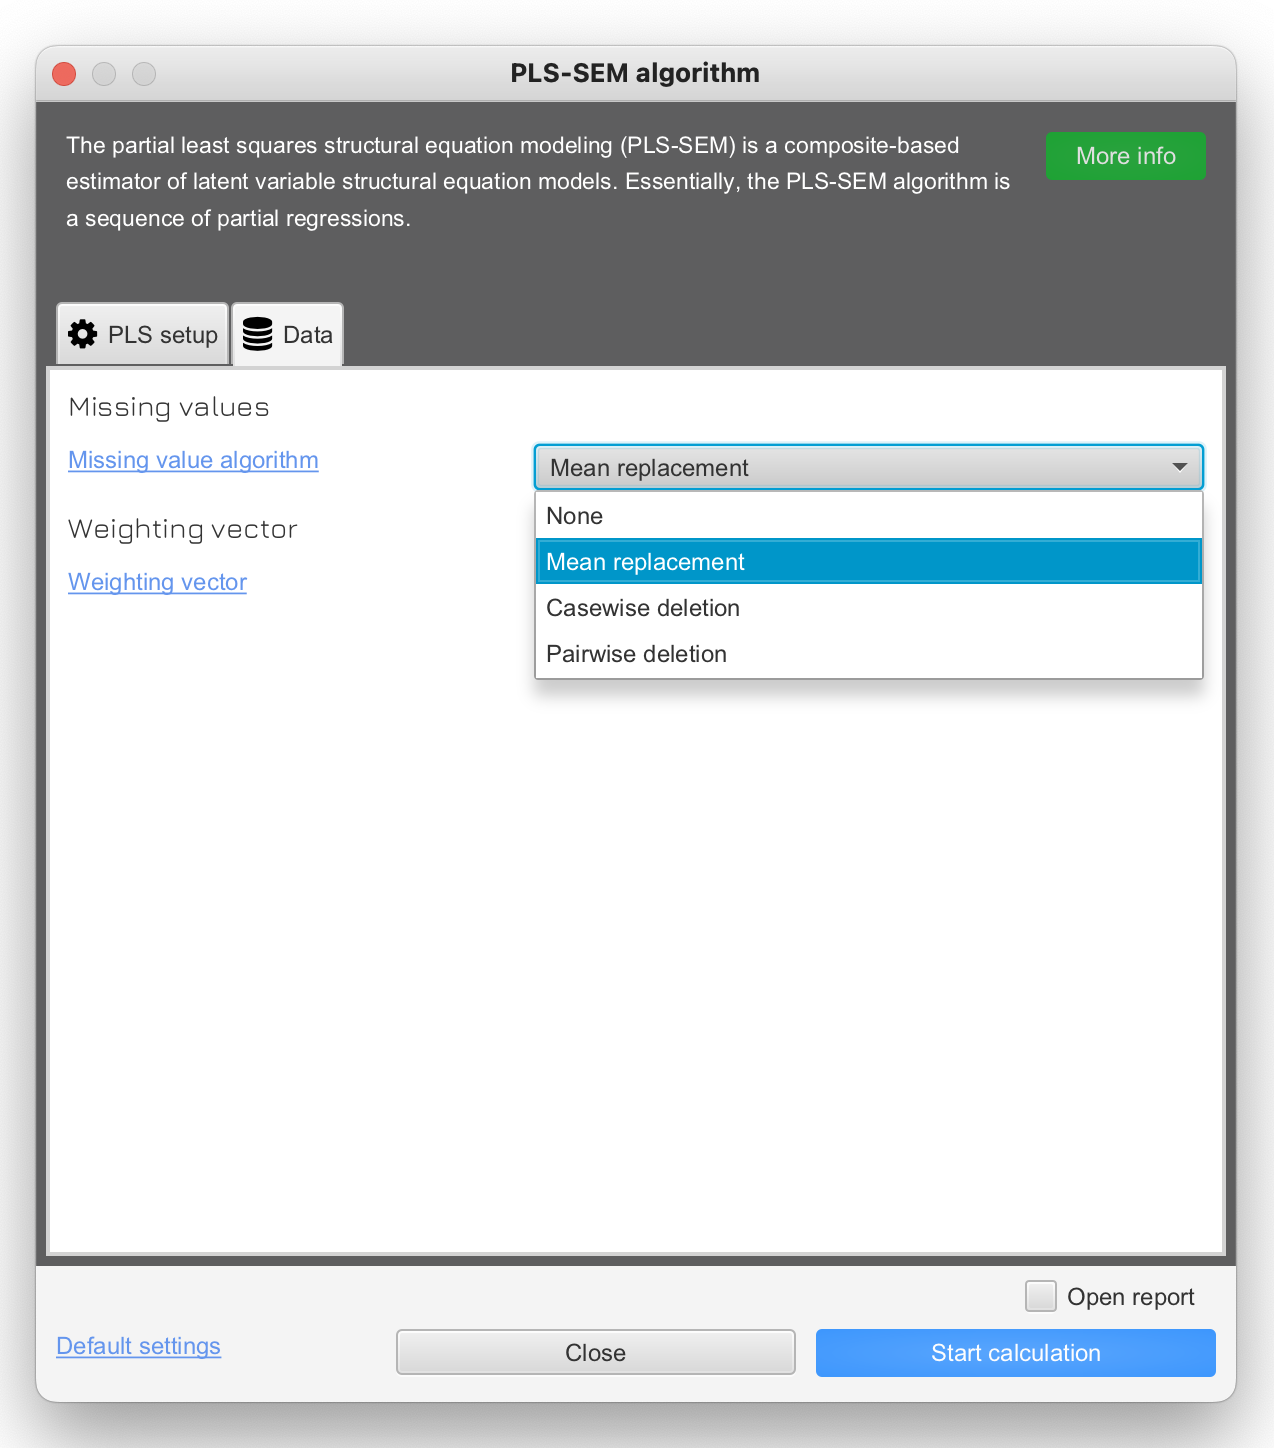
You have missing data in your dataset but use no or a different missing data treatment option in SmartPLS 4. When running an algorithm, please make dure to use an identical missing value treatment procedure.
Indicator scales not set up correctly
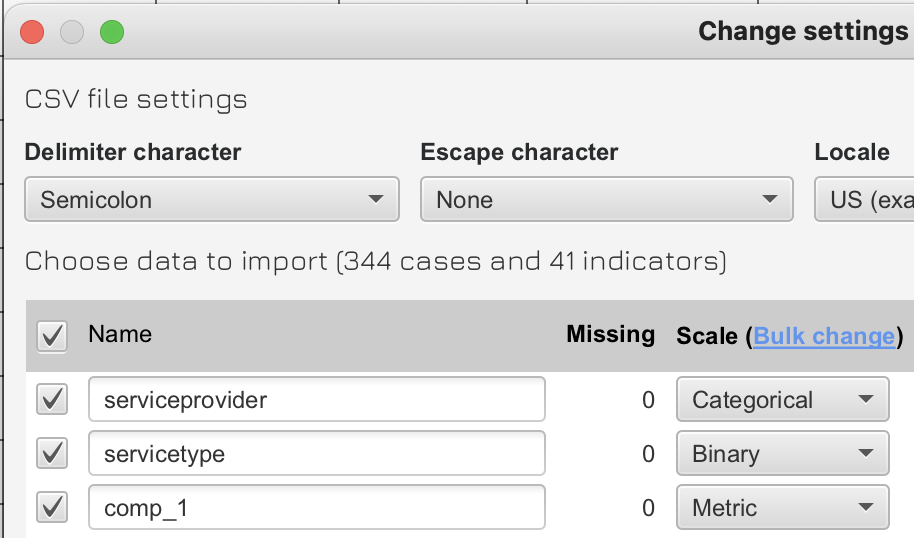
SmartPLS 3 only considered metric data. But if you used a binary variable for two categories in SmartPLS 3 (e.g., gender), then the values 0 and 1 (or 1 and 2) were use as metric scale in SmartPLS 3. SmartPLS 4 allows you to assign the correct metric to the variable and corrects the computations accordingly.
Also, your model can become invalid, e.g. it is not possible to compute results for models that have binary and categorical in certain parts of the model (e.g. in reflective measurement models together with metric variables).

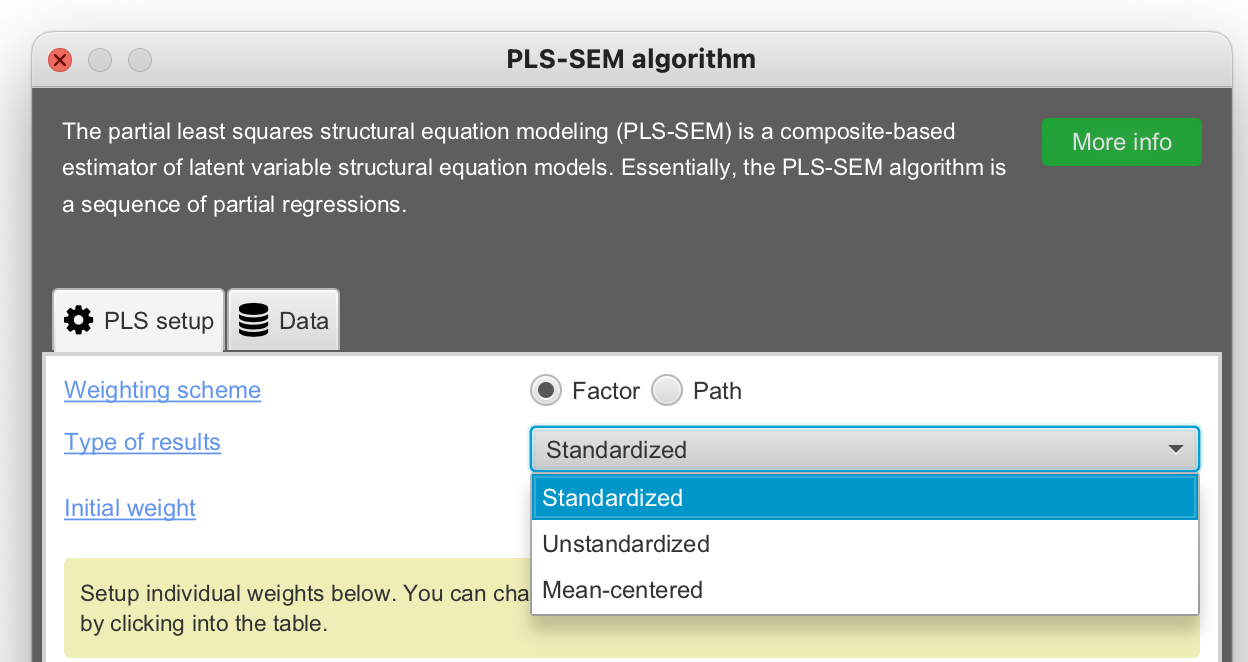
“Standardized” vs “Unstandardized” results
You do not select the option “Standardized” for “Type of results” in the dialog of the PLS-SEM algorithm but “Unstandardized” of “Mean centered”. Change this setting to “Standardized” as you used it automatically in SmartPLS 3 before.
Using Binary Predictors in SmartPLS 4
In SmartPLS 3, all variables and constructs were automatically standardized — including binary variables. However, standardized binary predictors are difficult to interpret and require manual unstandardization to obtain meaningful results. The effect of a standardized binary variable does not represent a change from one category to another but rather an abstract difference between categories scaled by the standard deviation, which depends on the prevalence or group proportion of the categories in the sample. Using standardized binary variables as moderators creates additional interpretation problems because the reference point (zero) is the mean of the variable. However, the mean of a binary variable does not represent either category. Therefore, the estimated conditional effects are not representative of either category but rather some probability-weighted average in between.
In SmartPLS 4, binary variables and constructs are therefore kept unstandardized (they are dummy-coded as 0/1). The resulting coefficients are partially standardized coefficients that represent the effect of a category change — specifically, the effect of the category that is coded “1” compared to the “0” reference category — in standard deviations of the outcome (dependent variable). For example, a 0.4 effect of a binary variable implies a change of 0.4 standard deviations on the outcome variable when changing from the reference category “0” to the other category “1”.
Tip: If you would like to obtain the “old” SmartPLS 3 results, define your binary variable as metric in the data file setup.
Further reading: Becker, J.-M., Cheah, J. H., Gholamzade, R., Ringle, C. M., & Sarstedt, M. (2023). PLS-SEM’s Most Wanted Guidance. International Journal of Contemporary Hospitality Management, 35(1), 321–346.
Binary Data: No Mean Replacement for Missing Values
Starting with SmartPLS version 4.1.1.5, mean replacement is no longer applied for missing value treatment in models that contain binary indicators.
Why? Mean value replacement assumes that a variable is metric, meaning that its values have quantitative meaning and that the mean represents a valid measure of central tendency. However, binary indicators represent categorical information (e.g., yes/no, present/absent, female/male) and therefore do not have a meaningful average. Replacing missing binary values with a mean (e.g., 0.35 or 0.62) would introduce non-binary and uninterpretable values into the dataset. To avoid such problematic imputations and potential bias, SmartPLS automatically disables mean replacement for binary variables.
In case you like to **reproduce "old” results (e.g., if your binary variables were originally intended to be treated as metric variables), you can easily adjust this setting:
- In the Workspace view, double-click your dataset.
- In the data table, locate the relevant variables.
- Change the Scale Type from Binary to Metric.
- Save your changes and rerun your model.
Note: This adjustment enables mean value replacement as in SmartPLS 3 and reproduces earlier results. However, when a binary variable is defined as metric, it is standardized before model estimation. This creates the previously mentioned problems with the interpretation of results.
To ensure correct interpretation, SmartPLS 4 does not standardize variables coded as binary and codes them as 0/1 dummy variables. This ensures that path coefficients remain interpretable when binary data are included.
For details on manually adjusting coefficients (and the corresponding bootstrap confidence intervals) when treating binary variables as metric, see:
Becker, J.-M., Cheah, J. H., Gholamzade, R., Ringle, C. M., & Sarstedt, M. (2023). PLS-SEM’s Most Wanted Guidance. International Journal of Contemporary Hospitality Management, 35(1), 321–346.
Becker, J.-M., Cheah, J. H., Gholamzade, R., Ringle, C. M., & Sarstedt, M. (2023). PLS-SEM’s Most Wanted Guidance. International Journal of Contemporary Hospitality Management, 35(1), 321–346.

